Ratio between CLTV:CAC
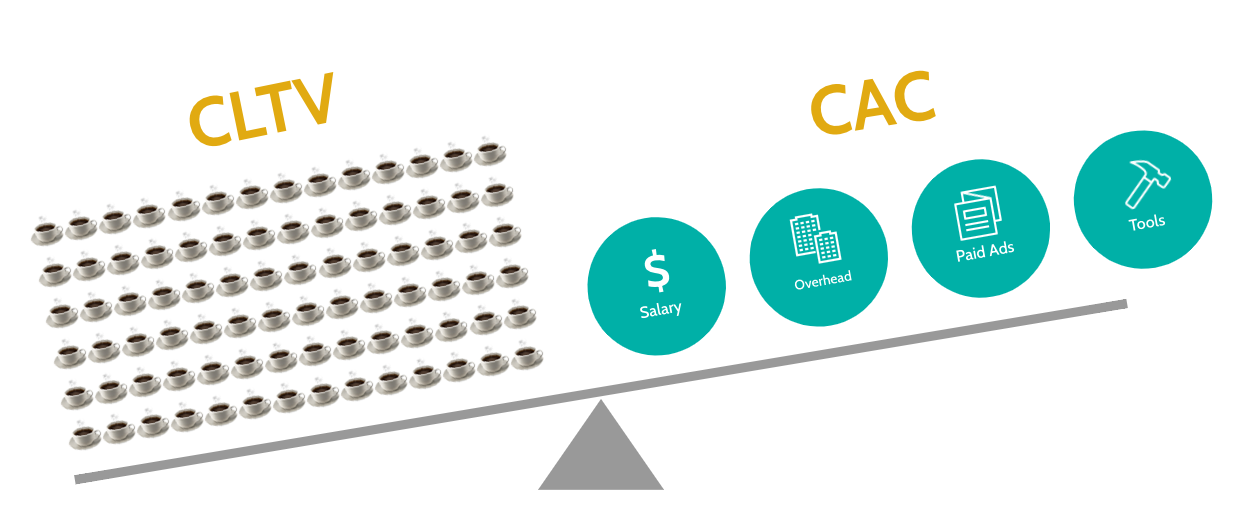
The following chapter deals with the relationship between Customer Lifetime Value (CLTV) and Customer Acquisition Cost (CAC). Merging the two KPIs is extremely effective.

On one hand, you can see what your commercial team is costing you per new customer acquisition: You have the cost of salary, overhead such as rent, the Porsche of your Sales VP, your paid ads, tools like Salesforce or Hubspot.

On the other hand, you have your Customer Lifetime Value, the total revenue you can expect from each customer over their entire customer lifetime.
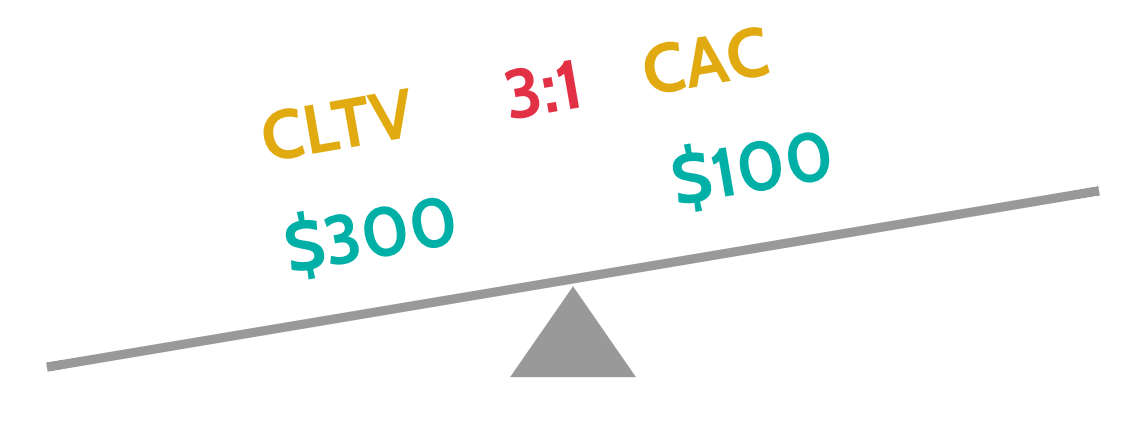
Therefore, of course, we have to earn more money with our customers than we spend in the first place to win them. In general, we want this ratio to be between 3:1 and 4:1.
That means you earn 3 times more on a customer than you initially spent on acquiring them. Or in numbers, if you earn $300 with CLTV, you don’t want to spend more than $100 on customer acquisition.
But there is an imbalance on the other side of the equation as well. If I produce a ton of CLTV but spend very little on customer acquisition. How is that possible?
Why a high CLTV:CAC is bad
I once did a project for a company that had super loyal customers. The company hasn’t lost a single customer for years, and their customer lifetime value (CLTV) was constantly increasing.
And the best thing about it? They only had one sales person. So their CAC was super low. They thought they SNAILED IT.

But they were making a critical mistake in their conclusion. Do you know what it is?
Suppose this company had a CLTV to CAC ratio of 10:1, which means that it spends only $100 to acquire a customer, but receives $1,000 in CLTV.
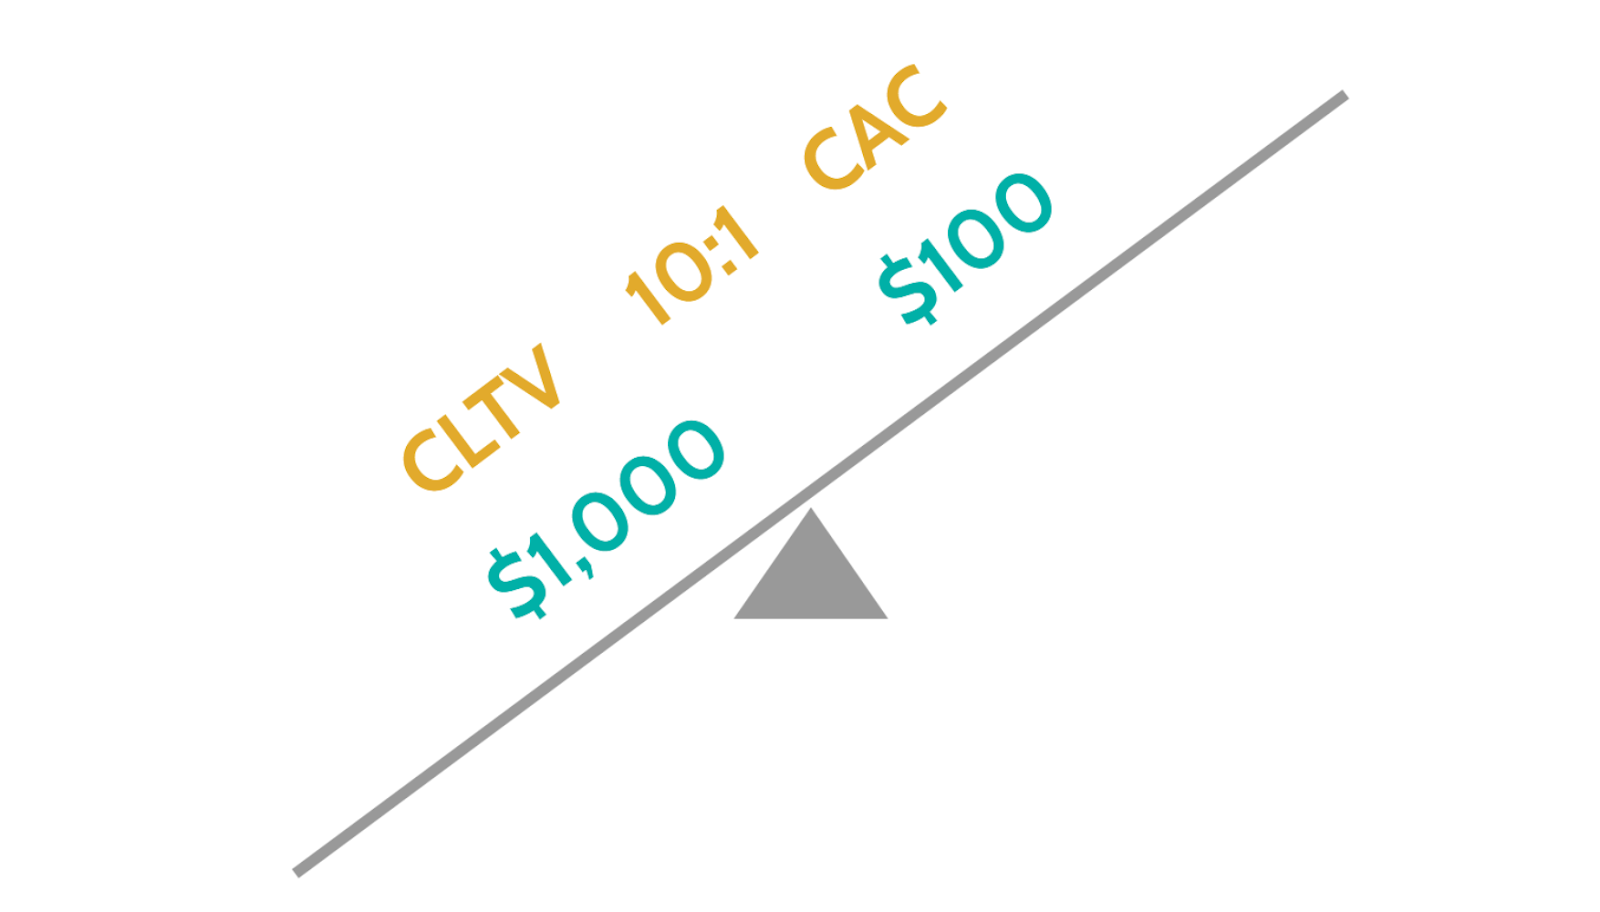
The critical mistake was that this company could have spent much more on sales and marketing. In this way, they could have reached many more potential customers and earn more money overall at the end of the day.
See, sales and marketing expenses are costs, but they are also an investment. An investment to attract more customers, and you can usually never have enough of them.
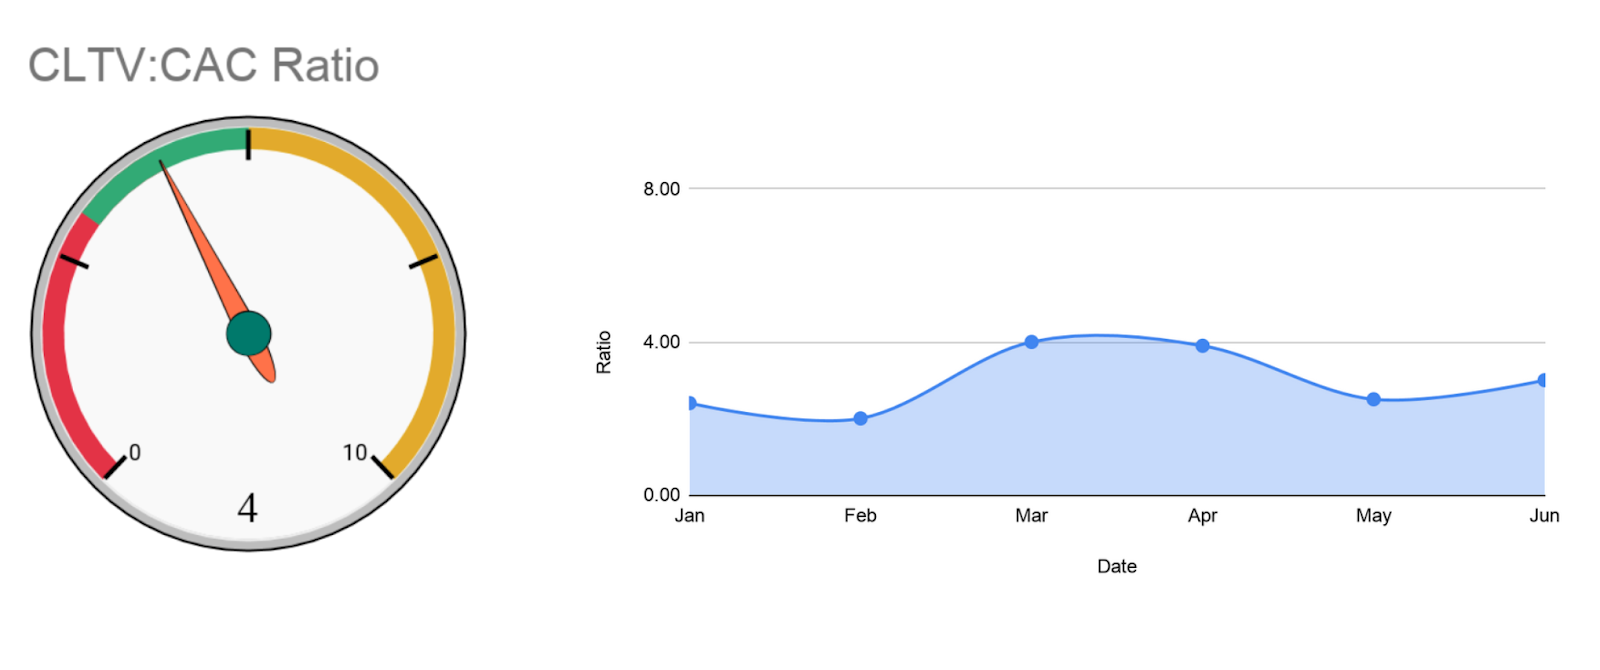
CLTV:CAC Gauge
I came across this gauge animation a few years ago, and I like it a lot. The gauge shows us in green the ideal ratio of CLTV to CAC. Somewhere between 3:1 and 4:1.
If we reach into the red area, we are not making enough money back on our investment.
If we are reaching the yellow area, a ration higher than 4:1 – we could potentially invest more in sales and marketing and reach out to more prospects.
In the blue chart next to the gauge we see our ratio over time. This allows us to identify trends over time and the impact of certain events, such as marketing campaigns or whether restructuring the sales team has had a positive impact.
Personally, I like to use the CLTV to CAC ratio to identify products that work best or to find out which industries to focus on. What do I mean by this?
The table where it all comes together
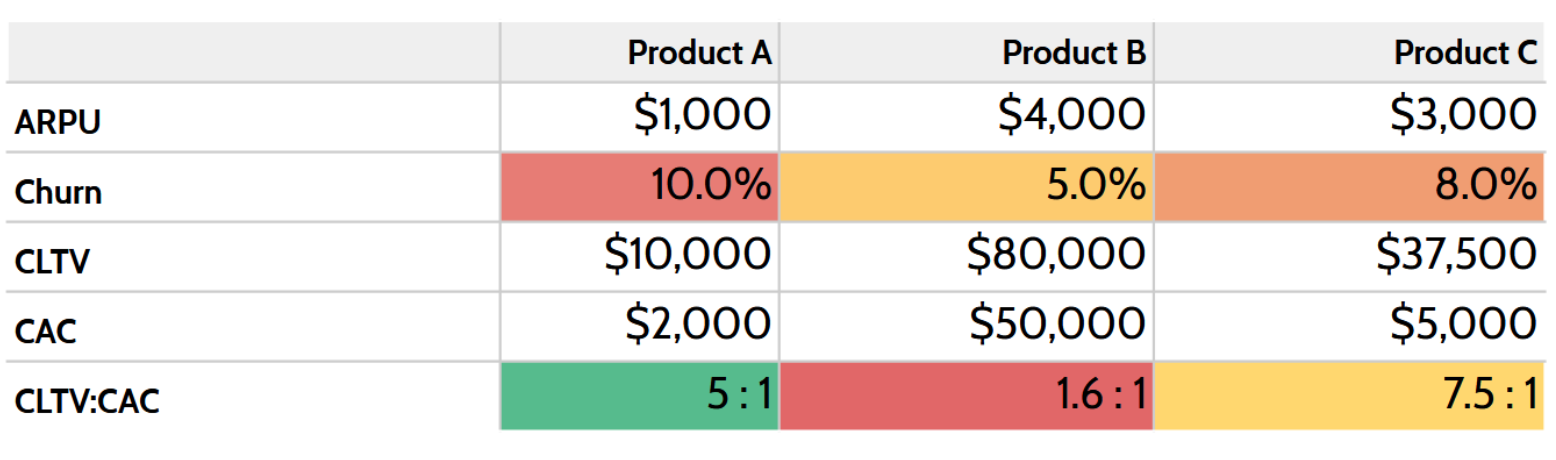
What we see here is a small, innocent table, but don’t be fooled by its appearance, this table is loaded with huge amount of information that brings together all the knowledge you have acquired in the previous chapters.
In the first row we see our Average Revenue per User (ARPU) for all our 3 product offerings. Below we see the Churn rate by every product. The darker the red, the more concerning the churn rate of the specific product.
Further below is our Client Lifetime Value (CLTV) and under that is the money we spent to get a client for a specific product, the CAC, and last but not least your CLTV to CAC ratio.
With this tiny chart, we have a darn good understanding which products work well and which aren’t. You are absolutely right that we have SNAILED IT on this one.
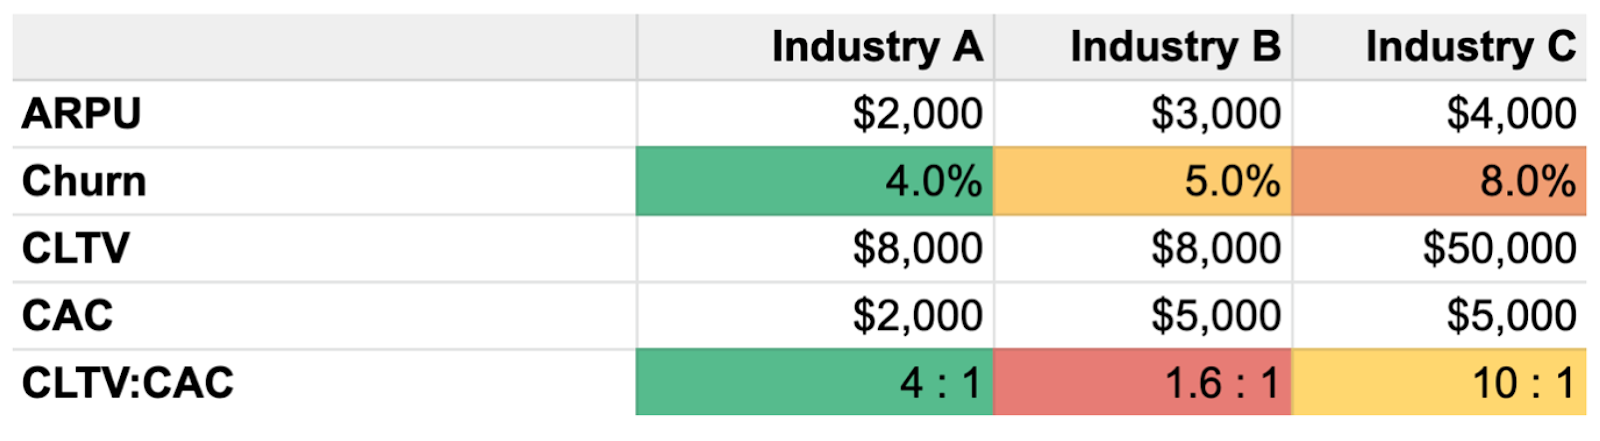
KPI table for based on Industries
We can do the same for industries. Again we start with our ARPU, then Churn, CLTV, CAC and the ratio between CLTV and CAC. This chart shows us in which industries it is difficult to gain new customers, but also which industries are worth expanding into. Only a few numbers, but huge strategic decisions for your company. That’s the beauty of KPIs. Vast amount of information compressed in one key performance indicator.
We have come a long way. You now understand all the metrics in this table and how they are put together. Well done!
Summary
The CLTV to CAC ratio provides us with answers to a lot of questions:
Sales: What costs can I justify to acquire a new customer?
Marketing: How much can I spend on a campaign?
Customer support: How much can I spend on retaining a customer?
Strategy: What products & industries should the sales team focus on?
As usual, all calculations and graphs are included in the KPI calculator. Thank you so much for reading and feel free to check out my online course where I explain the 20 most common SaaS metrics. Bring your reporting to the next level – Silicon Valley style.