Churn Rate
In this chapter you will learn: What Is a Churn Rate? And how to Calculate Churn?
So first of all, what is the churn rate? The churn rate is the percentage of your customers that are terminating their subscription over a certain time period.
An example: Netflix has 10 million monthly subscribers, but 2 million of them cancel their subscription every month. In this case Netflix would have a churn rate of 20%.
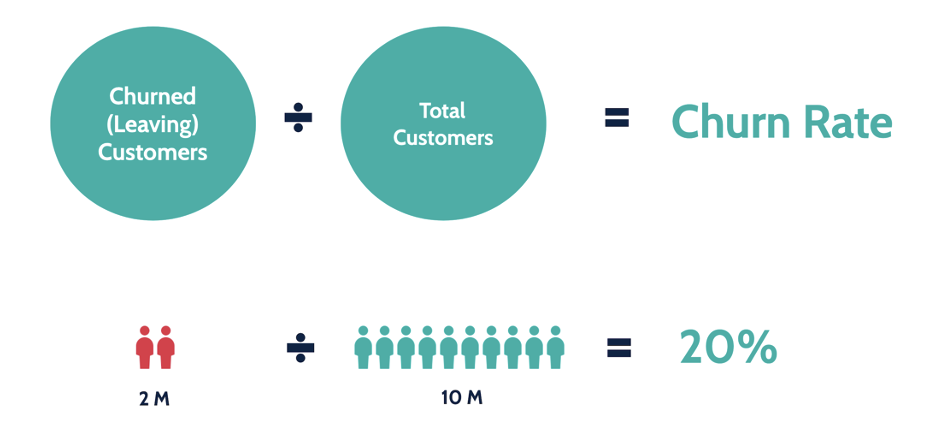
Now, 20% is a really terrible churn rate, but actually not unheard of. CRM software Salesforce had a churn rate of 8% in 2008, PER MONTH, meaning they lost 25% of all their customers each quarter.
Meanwhile new client acquisition was looking great, sales was crushing it and they were adding tons of new clients, but it was not until they solved their churn issue that Salesforce became the giant software company we know today.
Importance of Churn
The problem with having a high churn rate is that churn behaves much like trying to fill water into a leaky bucket. If you gain 20 customers every month, but also lose 20 customers, then you are right back where you started.
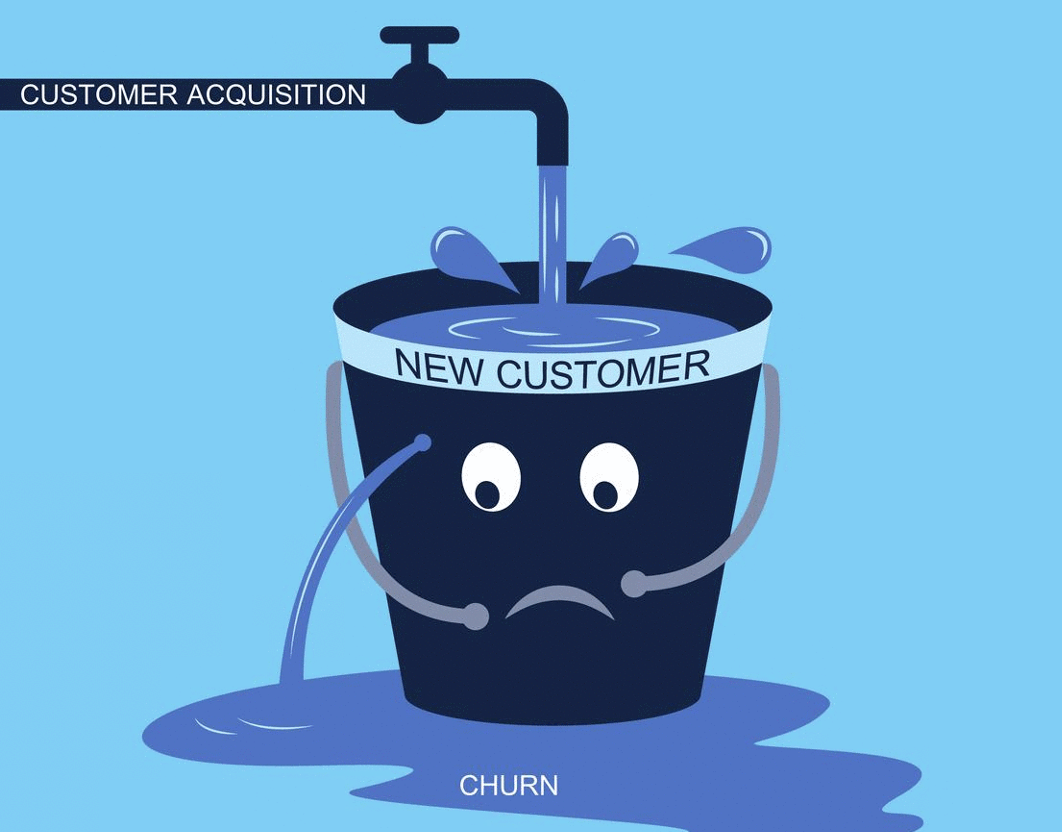
You only start to make money when you plug the holes of the leaky customer-bucket. In other words: Your growth rate needs to exceed your churn rate.
That is why churn negatively affects a lot of other KPIs (Key Performance Indicators) discussed in the KPI MAX online course / website. And with high churn, you can’t focus on increasing the value of your existing customers, and that’s where the real money lies.
Therefore, the churn rate is an important indicator that can help you identify problems, which makes it counterproductive to bias these numbers, or in the words of Steli Efti, the founder of close.io:
“Don’t approach churn by trying to put lipstick on a pig”– Steli Efti
He says that because a lot of people have a tendency to calculate churn in a way that makes their company or department look better than it is. And there are a lot of ways to bias these metrics, but no one will be able to trick you, not after you finished this chapter.
Monthly or Annual Churn?
Back to our Netflix example: First we have to learn the importance of the time period we select for measurement. Customers cannot cancel their contract before it expires, right?
That’s why we would choose the period of our subscription plans. In the case of Netflix, this would be a monthly plan.
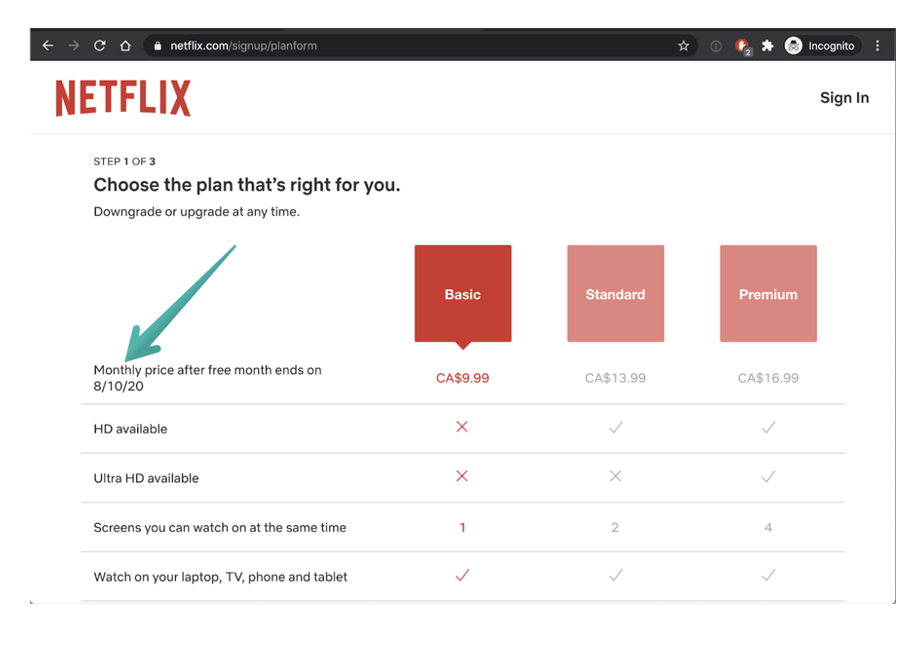
Other companies offer annual packages. If you have a mix of monthly, quarterly, and annual, I would recommend using the average contract term to calculate the churn rate.
But be careful, you don’t want to choose a time interval that is too short to cover enough churn, or
too long, so it covers too much – otherwise your numbers could contain statistically insignificant and random results. For example, it is not really helpful to compare 2.91% with 2.93%.
Another thing to keep in mind is that the tighter you narrow your window, the more volatility you can expect. To avoid this, try to play around with time windows and select the golden time interval that makes the most sense for your business. But if you can, choose monthly or yearly because it makes it easier to compare yourself with other companies.
Neat by-product: Average Customer Lifetime
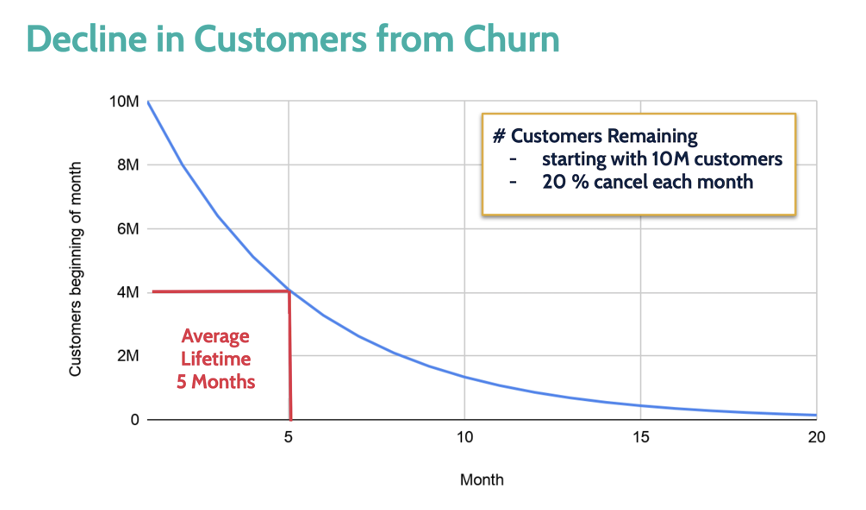
Additionally, a nice by-product of the churn rate is that you can calculate the average time someone is a customer. All you have to do is divide 1 by the churn rate.
If we apply this to our Netflix example and divide 1 by 20%, we can see that the average time someone is a Netflix customer would be 5 months.
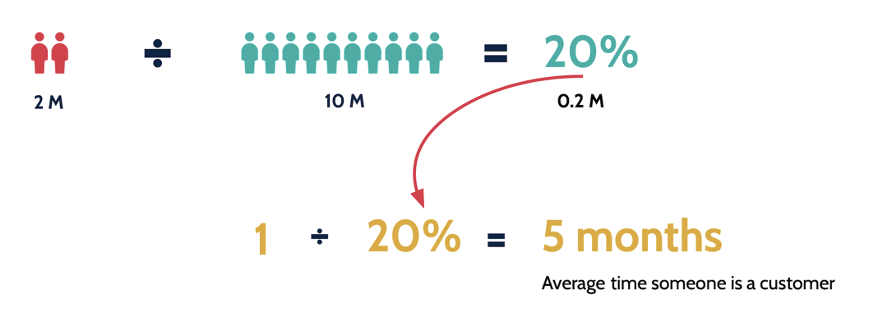
But as I said – 20% is a terrible churn rate and certainly not true for Netflix. Here is a chart for a churn rate over time and it shows why we can calculate our average time someone is a customer this way. As you can see, our average lifetime is 5 months, and if we don’t acquire new customers, we would be out of business within 20 months.
Churn Rate YoY (Year over Year)
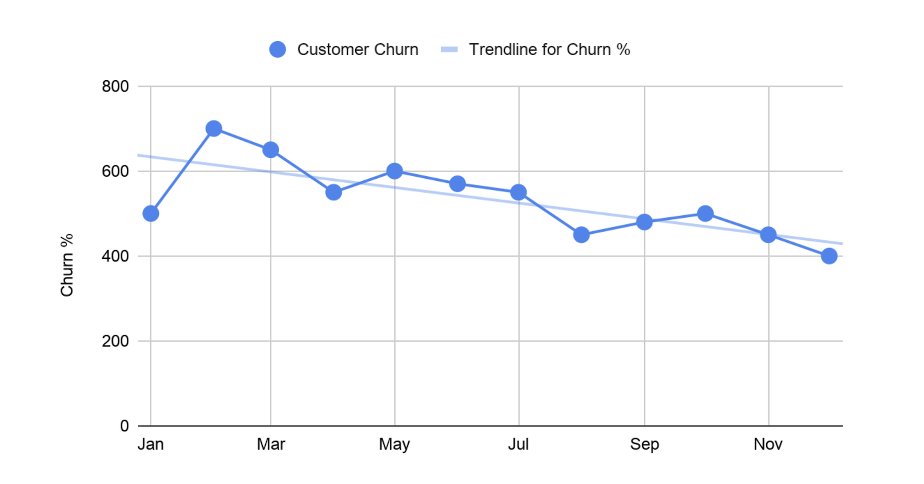
What you can see below is a chart of a churn over the period of a year. We can see that the churn rate decreases over time, which means that fewer customers cancel their subscription. Happy campers! I usually like to add a trendline to make this especially clear. This chart works really well unless you look at the churn rate of a company that is in a state of hyper-growth.
Companies with Hyper-Growth
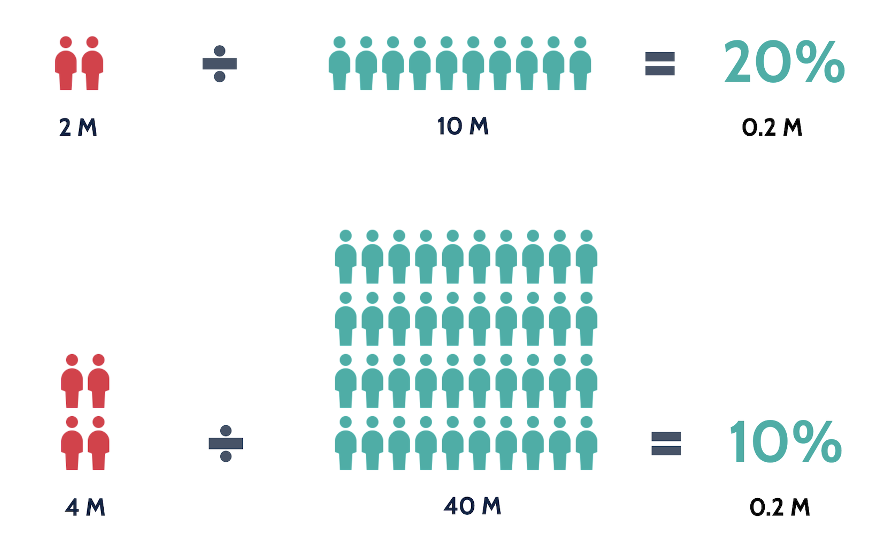
You see, if you have a lot of growth, both – your customers who JOIN AND LEAVE will increase.
Comparing both figures with the previous month, your churn rate will decrease even if you have more customers leaving your subscription than in the previous month. In this example, twice as many customers leave your product, 4 million instead of 2 million. Nevertheless, our churn rate drops from 20% to 10%. – This is not a problem for more or less stable companies.
Segmentation
Sometimes it also makes a lot of sense to segment your products. Let’s say you sell a basic and an ultra-premium enterprise plan. Typically, the lower tiers have a higher churn rate of employees than the enterprise tiers – If you have similar pricing in your company, I would probably separate them out.
Seasonal Businesses
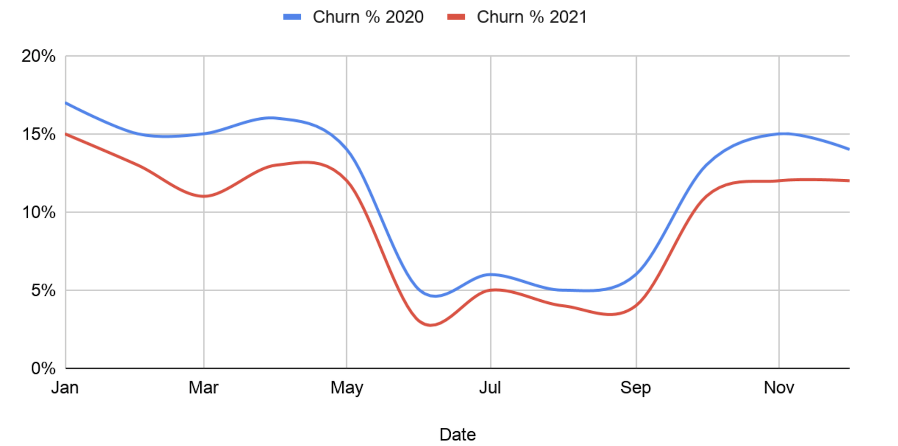
And be careful if you have a highly seasonal business. Suppose you have an app that recommends summer adventures. In that case, I recommend that you make a yearly comparison in your chart instead of comparing this month’s churn rate with the previous month’s. This will give you a much clearer picture.
Customer Churn vs. Revenue Churn
The churn rate is an important indicator and we will inevitably come back to it and look at the impact on our other indicators. The last thing I want to explain now is the difference between customer churn and revenue churn. So far we have only looked at examples of customer churn. But usually we are much more interested in learning about revenue churn. Why is that?
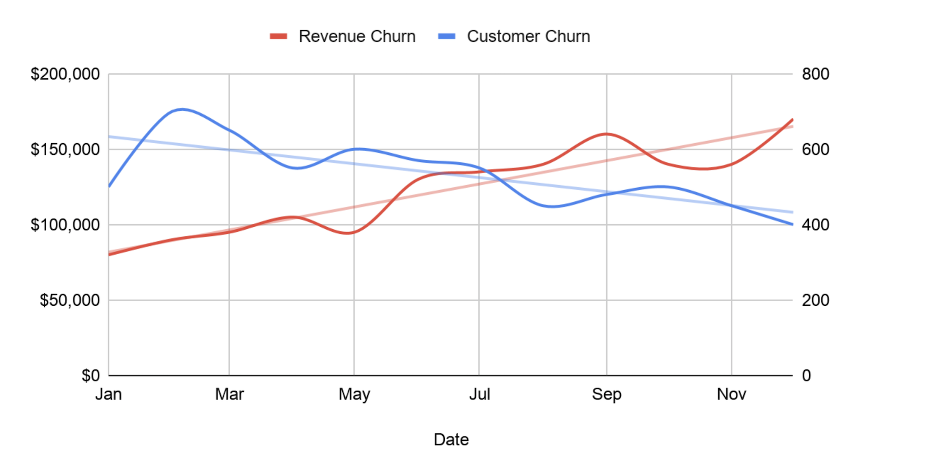
Well, what if your customer churn is decreasing but your sales churn is increasing? You have read correctly, both churn rates can go in opposite directions. That is what we are dealing with in the chart below. In blue we have our customer churn that is decreasing and everything looks good. But our churn rate in red is increasing. Bad news! This is definitely not what we want. I’m sure we can deal with fewer customers as long as we make more money, but definitely not the other way around.
KPI Calculator
Let’s have a look at my KPI calculator. In blue on top you can plug in your numbers to calculate the customer churn rate. And right below in red – the revenue based churn. As you can see, both churn rates are calculated exactly the same. We take the revenue we lost in a given period and divide it by our total revenue we generated in the same period. In green I also included the inverted churn rate, the neat side product of knowing your churn rate, to see your average customer lifetime.
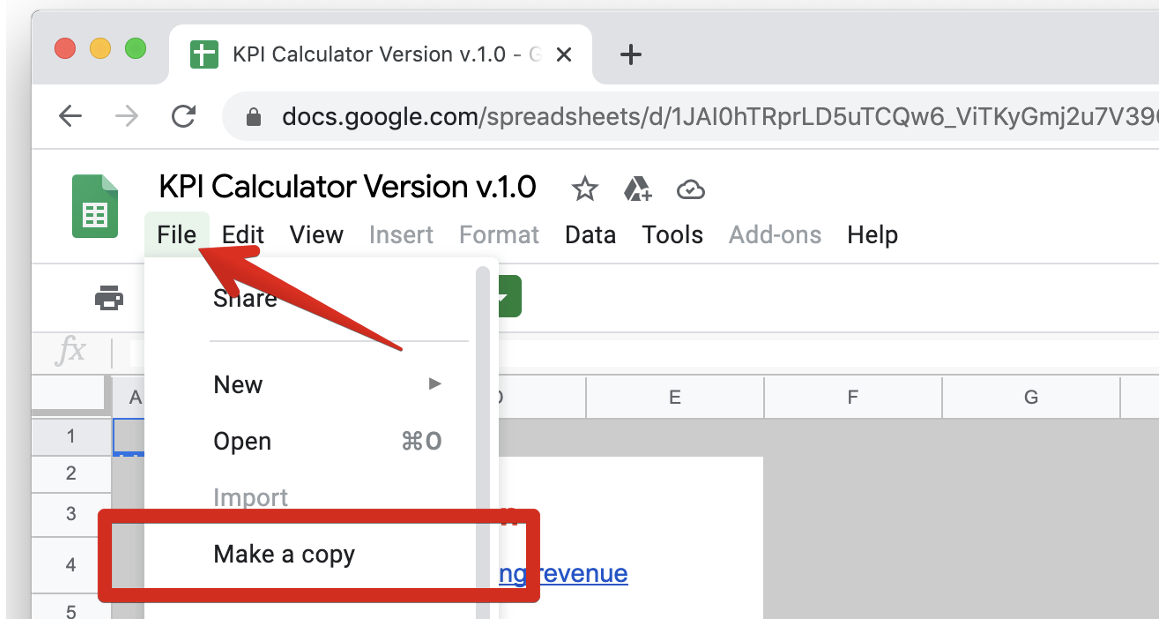
If you want a copy of my KPI Calculator simply enter your email address below and I will send you the link to the spreadsheet.

FREE SALES METRICS CALCULATOR
Use this Excel template to calculate the Churn rate and other KPIs.
KPI Calculator
Summary
The churn rate is the ratio between customers that are terminating your service to your existing customers.
Having churn is like filling a leaky bucket. The bucket will never hold your stream of revenue if you don't fix the leaking ´churning´ revenue holes.
With the inverted churn rate you can calculate the average time someone remains your customer.
And don’t approach churn by putting lipstick on a pig. Choose a meaningful time span such as monthly or annually, separate out different product categories such as expensive enterprise plans and be careful in times of hyper growth.
And lastly, know the difference between customer and revenue based churn rate
Thank you friends, and feel free to check out my online course in which I explain the 20 most important SaaS metrics in 2 hours.
The churn rate is the ratio between customers that are terminating your service to your existing customers.
Having churn is like filling a leaky bucket. The bucket will never hold your stream of revenue if you don't fix the leaking ´churning´ revenue holes.
With the inverted churn rate you can calculate the average time someone remains your customer.
And don’t approach churn by putting lipstick on a pig. Choose a meaningful time span such as monthly or annually, separate out different product categories such as expensive enterprise plans and be careful in times of hyper growth.
And lastly, know the difference between customer and revenue based churn rate